XBRL and AI: a bad marriage or a match made in heaven?
XBRL is now the standard for financial reporting. Where reports used to be filed as PDF documents or Excel sheets, the XBRL standard has provided regulators with machine readable data. The fact that it’s machine readable has significantly improved data quality, as business rules can be applied when the data is submitted. Many regulators want to take it a step further and apply artificial intelligence on the data they receive.
From data to insights
Once regulators receive the data, they want to analyse it and gain insights by performing comparisons between organisations, year-over-year. However, this is not a trivial task. XBRL and AI have very different approaches to data. To gain a better understanding, let’s explore the differences below.
- XBRL data is very structured. An XBRL taxonomy describes data structures and how the data is to be presented. It holds definitions for business rules to safeguard data quality.
- AI deals with data that is often unstructured, with little knowledge of data types, and no knowledge of business rules whatsoever.
- XBRL uses an XML dialect, which allows nested structures.
- AI primarily uses languages like Python and R, which work best with flat structures (CSV and other row-based data), or JSON.
- XBRL data is highly dimensional1
- In AI and machine learning, having fewer dimensions simplifies processes such as training and validation.
- XBRL has business rules to validate the internal consistency of a filing and rejects a filing if business rules fail. This results in higher data quality.
- AI doesn’t assume high data quality upfront-- there are ways to handle missing data (e.g. imputation).
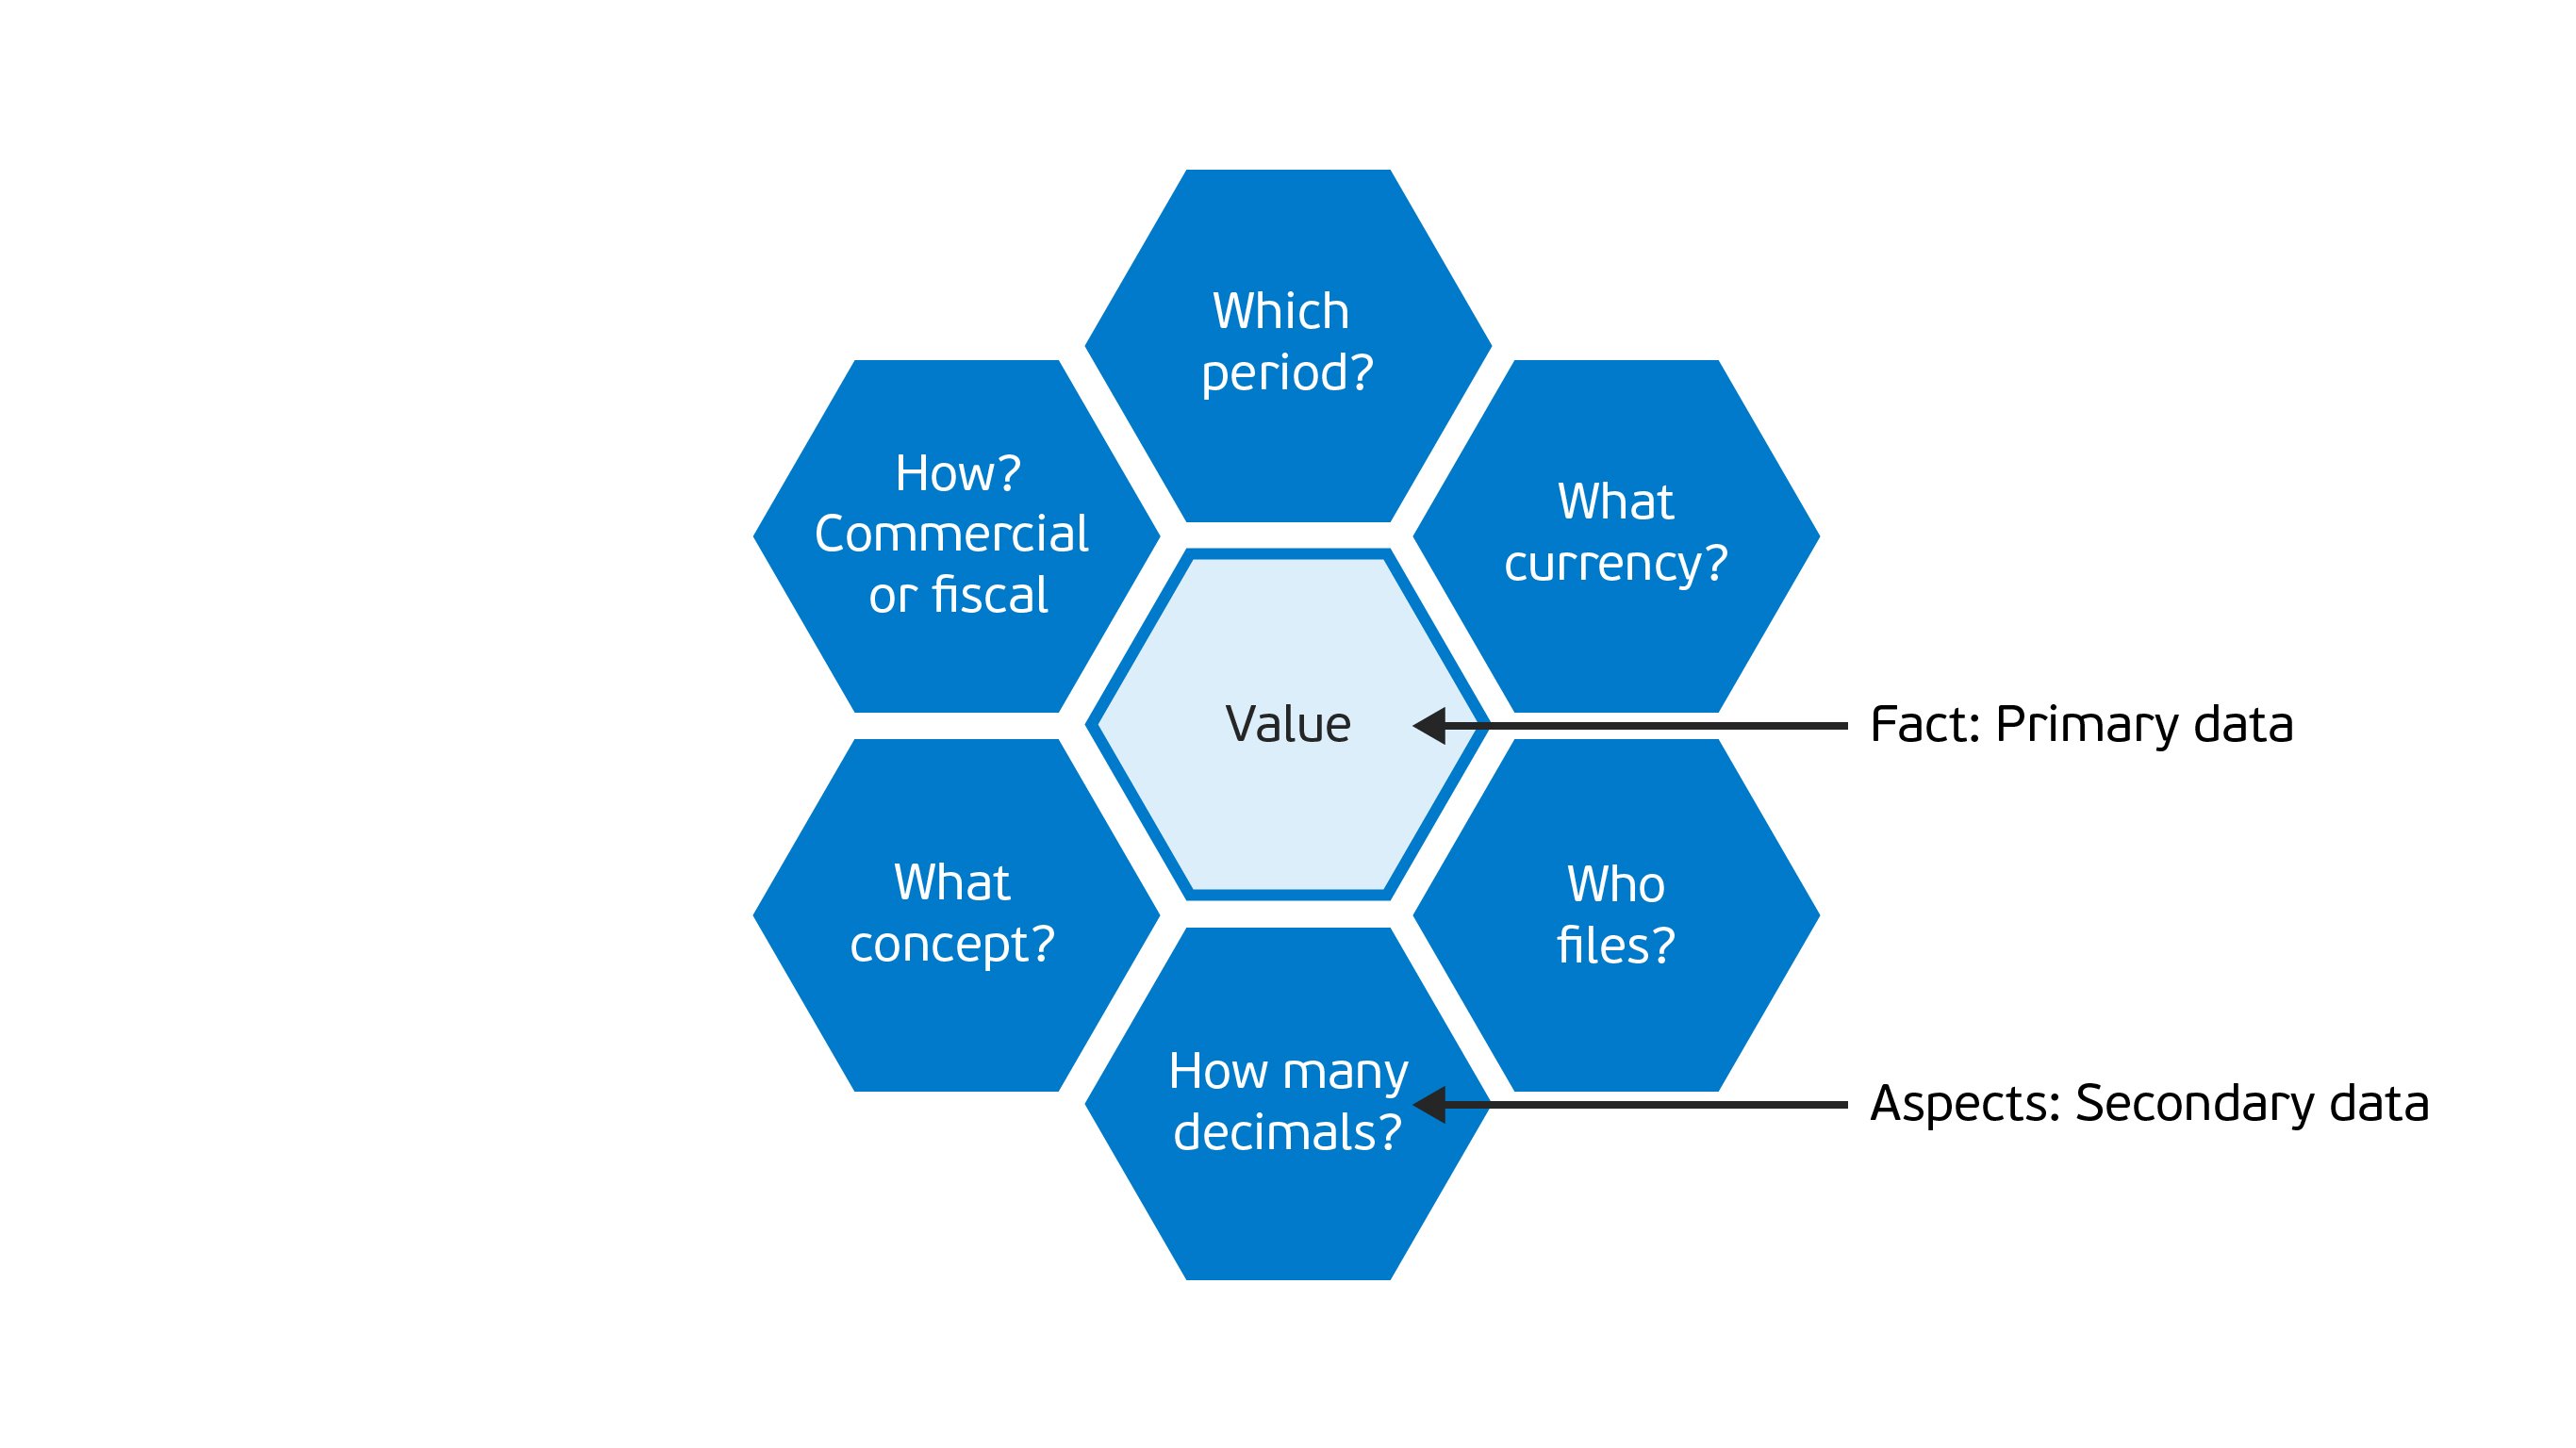
An XBRL data point is not like a single value for a column in a CSV file. A data point is a value with a group of aspects describing that value. Whenever you report a value, you also report the What, Who, and When. Namely, what concept is being reported, who reported it, when it’s reported on.
The picture below shows the structure of an XBRL data point2:
Primary and secondary data is difficult to handle in AI techniques, such as machine learning. Machine learning works best on tabular data (rows and columns).
If we want to apply AI to XBRL data at all, we need to overcome these obstacles. At Visma Connect, we believe it’s very well possible to apply AI to XBRL data by following a number of steps.
Processing steps
In order to transform XBRL data to a format that’s suitable for AI environments, we need to do the following:
Filtering
Filter XBRL by performing a selection on certain aspects like concept, period, currency, etc. This step needs to be done using software that has knowledge of XBRL. The software should know how to handle the data structures XBRL uses.
Example:- Filter on entity id 30267925.
- Filter only on currency Euro.
- Etc.
Flattening
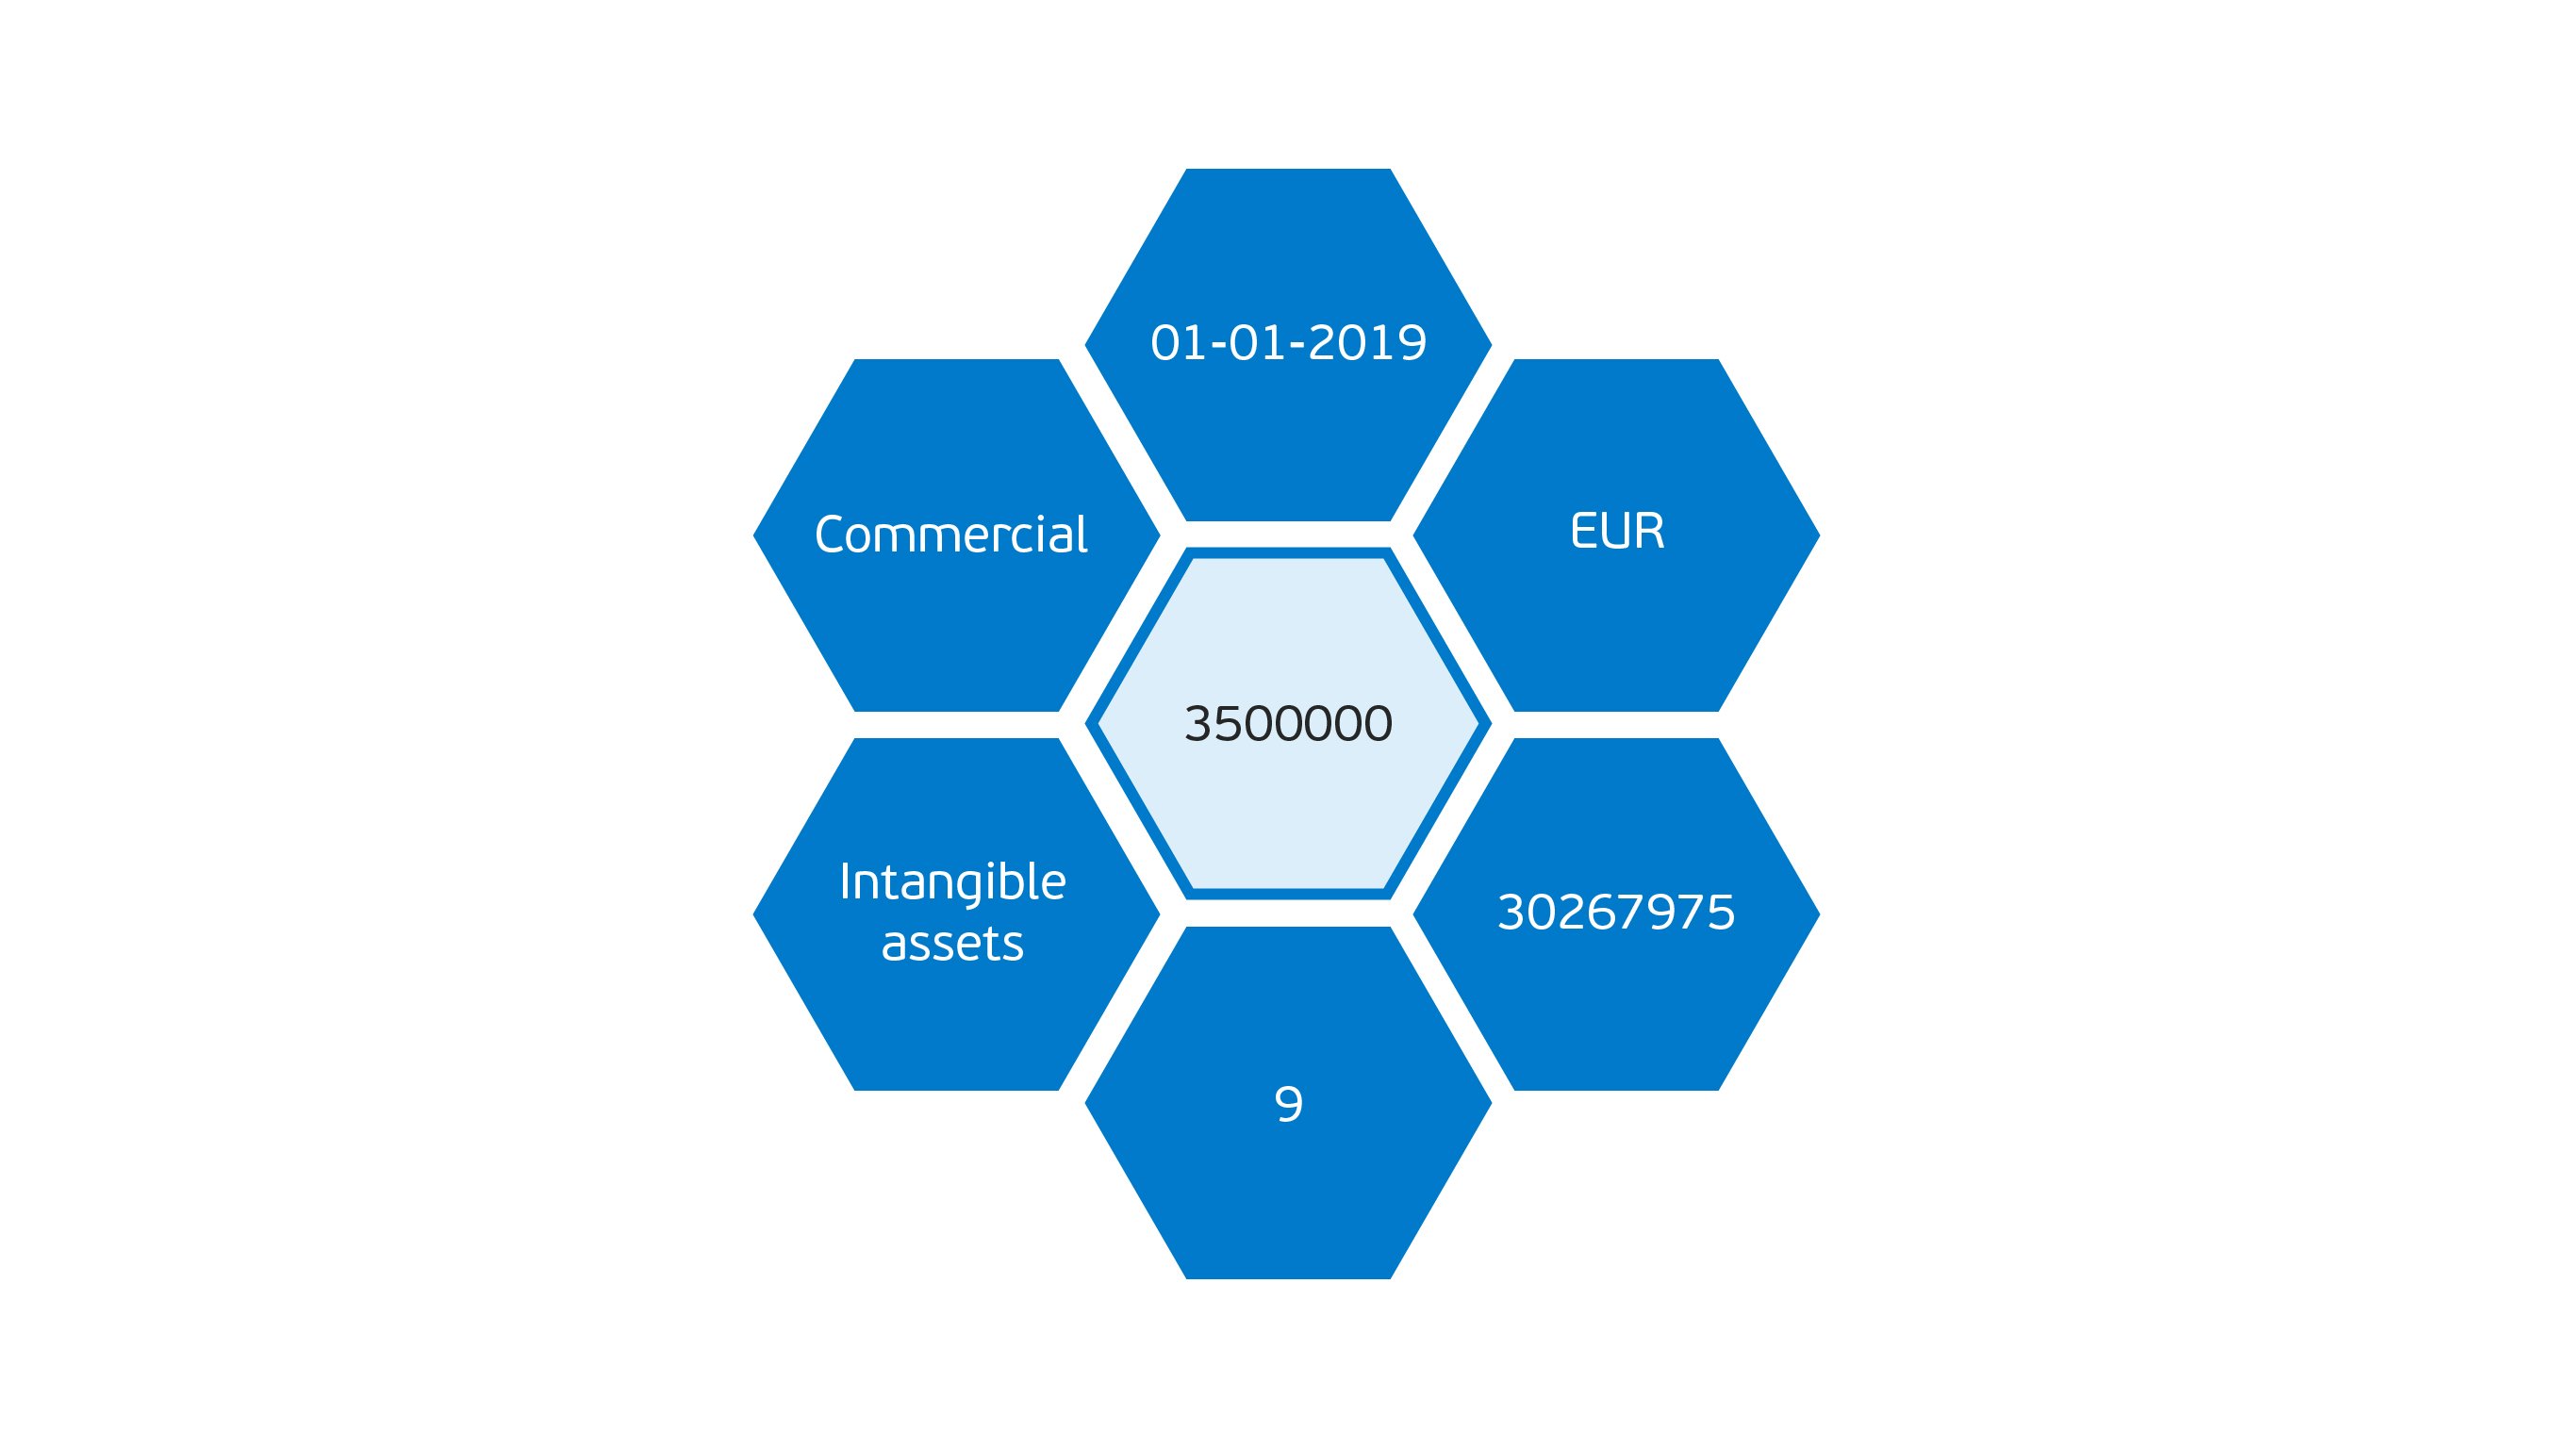
Once we’ve filtered the data and know which data we have on our hands, we can flatten the data. Rather than reporting the currency with every data point, we can extract the currency aspect and turn it into a separate datapoint. The same holds for other aspects like the period.
The next step is to combine data points in a row.This means all data points that report in a similar way are put in one row. Such tabular data is easier to manage in languages like R and Python.
The XBRL data point in the sample image above will look like this after these processing steps are applied:
|
entity_ identifier |
period_instant |
currency |
basis_of_preparation_axis |
decimals |
concept_intangible_assets |
concept_sales |
| 30267925 | 01-01-2019 | EUR | CommercialMember | 9 | 350000 | 100000 |
Please note that the concept Sales is also reported in the same row, which has the same secondary data as the Intangible Assets concept.
Data analysis
Once we’ve filtered and flattened the data, we retain the high data quality and the structure described in the taxonomy.
As we analyse the data, we have to remove some fields that do not play a significant role in the training of the model. This will result in a better performing model. This process is called dimension reduction.
Many AI projects fail due to bad data quality or results are poor because the data’s structure is not well described. Data engineers normally have a hard time processing such bad quality data. In AI projects, the majority of time is spent on data processing, not on the data analysis itself. Here, using structured and high quality XBRL data turns out to be an advantage.
Do you want to start your AI journey?
At Visma Connect, we have the knowledge and tooling to work with XBRL. We build taxonomies for many of our customers in the SBR ecosystem. Visma Connect’s systems validate the messages processed by the platform and deliver the messages to various organisations.
We see that processing XBRL data can be difficult for organisations that receive it. Visma Connect implemented the XBRL OIM specification to transform CSV and JSON to XBRL and vice versa. This opens up a way to apply AI on that data.
AI-related use cases are numerous. Fraud detection is at its core, a classification problem. AI can separate authentic and fraudulent transactions by using the data points provided. The tax office could do this using historical data. If that’s not available, unsupervised learning could be applied to group similar transactions together, form distinct clusters, and clearly identify outliers. NLP (Natural Language Processing) can be applied to the disclosure texts.
Our AI team has experience with all kinds of data, including XBRL data. We can work alongside our customers to materialize the AI promise.
Contact

Contact us to learn more about the possibilities of XBRL and AI in your organisation.
Notes
1: The definition of the term dimension in XBRL is a different one from that in AI. For simplicity’s sake we use one and the same word here.
2: For simplicity’s sake some details were omitted from the pictures.