Forging a path to measuring, tracking & improving emissions estimation accuracy over time
Scope 3 emissions calculations rely heavily on external data. Where possible, actual emissions from value chain partners are used and where those are either unavailable or unreliable, third party databases are used. Therefore, businesses have very little control over the quality of the data they receive. This leads to one of the core challenges around Scope 3 emissions reporting: data quality - how to measure it and how to improve it over time.
In this blog:
- The importance of measuring, tracking & improving emissions estimation accuracy
- Visma Connect’s solution: A two-stage approach
- Benefits of the Quality Scorecards
- More than just a compliance exercise
Further reading below 👇

The importance of measuring, tracking & improving emissions estimation accuracy
High-level estimates based on industry averages are a useful way for companies to begin their Scope 3 measurement journey. However, to increase the effectiveness of emission reduction strategies in the long term, there needs to be reasonable certainty that estimates accurately represent actual emissions. This does not mean that all estimates have to be converted to actual supplier-specific data. Rather, resources should be focused in areas where they can have the best results.
A successful data quality improvement program should look to incorporate the following:
- Continuous improvement: targeting those areas that will have the greatest impact on the overall accuracy of emissions estimates and tracking progress over time
- Supplier engagement: Engaging with suppliers on improving data quality where it matters most to minimise their disclosure burden
- Transparency: Having clear visibility into the reliability of estimates for each Scope 3 category based on both data sources and calculation methodologies used
The quality and appropriateness of incoming data should first be assessed before a company decides whether or not to use it. Initially, where estimates are predominantly based on a handful of third party databases, this is a fairly straightforward process. As broad estimates are swapped out for actual supplier-specific data over time, the level of complexity in monitoring data quality rises rapidly. Without the proper tools, the volume of data originating from different sources with multiple formats can quickly become overwhelming.
“While perfection is impractical in the area of Scope 3, organizations can begin with available data to drive estimations, implementing targeted improvement programs to generate more accurate data over time. Carbon reporting software should enable this journey, meeting organizations where they are today, providing flexibility in calculation methodologies, and enabling transition between methodologies as needed.” 1
Only once the accuracy and quality of fit of incoming data have been determined should a company decide on which calculation method to use. Intuitively, one might expect that an emission factor received directly from a supplier should automatically be judged as the most accurate measure for calculating emissions. But what if that supplier didn’t calculate the emission factor themselves, having instead sourced it from an unverified third party database? What if they use the emission factors they calculated for products they manufacture using hydro-powered electricity in one country as proxies for products they manufacture using coal-fired electricity in another country? Or what if they simply allocate all their emissions equally across their entire product range, despite starkly different emissions profiles across their homecare versus nutrition product ranges?
Visma Connect’s solution: A two-stage approach
The Visma Connect ESG Data processor uses a two-stage approach to scoring the accuracy of emissions estimates, incorporating the data quality indicators from the GHG Protocol. It is designed to calculate emissions on a transaction-by-transaction basis; for example, the production of goods ordered is treated as a separate transaction from the distribution of the same goods. This is because a single production order can often be sent to multiple distribution centres, leading to differences in transport and distribution emissions. To simplify the explanation of the scoring process, I will limit the discussion to Category 1 Scope 3 emissions, namely purchased goods and services.
When scoring the quality of supplier data, there are several factors to consider:
- What proportion of the data is from primary (i.e. the actual product) vs. secondary (third party databases or other proxy data) sources?
- Is the secondary data used by the supplier a reasonable proxy for the product’s actual data?
- How complete is the data? For example, does it cover the full cradle-to-gate Product Carbon Footprint (PCF)?
- Who performed the calculation and what kind of assurance is there that the calculation is correct?
Below is an example of the first stage of data quality assessment: the Supplier Data Quality Scorecard. The breakdown is designed to flag potentially unreliable estimates and to pinpoint areas for engagement with suppliers to improve data quality. The summarised supplier data quality scores would be linked to specific products and reviewed annually. The results would then feed into the emissions calculation scoring that happens on a transactional basis in stage 2.
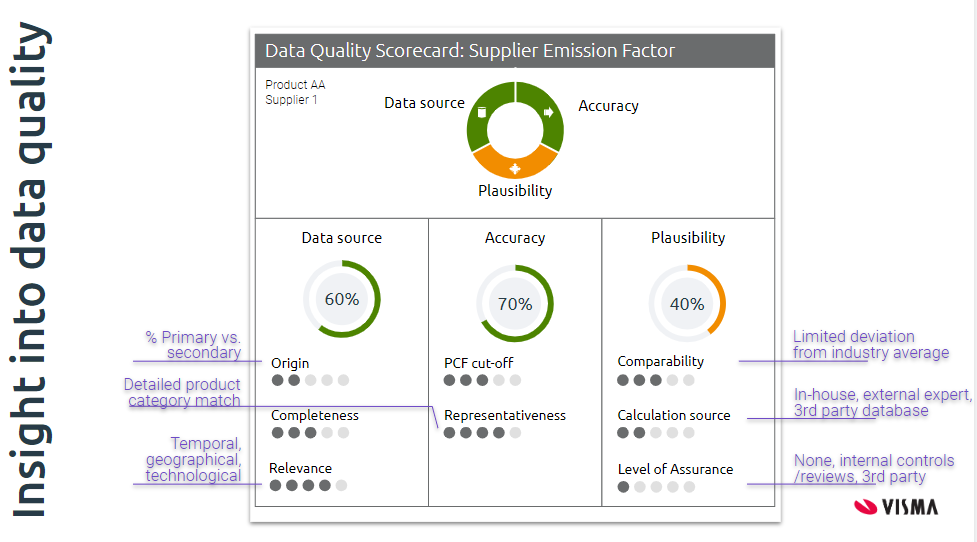
Fig. 1-1. First stage: Supplier Data Quality Scorecard.
Emissions per product order are calculated using each of the four calculation methods per the GHG protocol (spend-based, average-based, hybrid or supplier-specific), depending on the type of emission factors that are available for that specific product. The quality of each calculation will then be scored and the best fit selected for inclusion in the company’s total Scope 3 emissions. An example of the second stage, the Emissions Estimation Quality Scorecard, is included below.
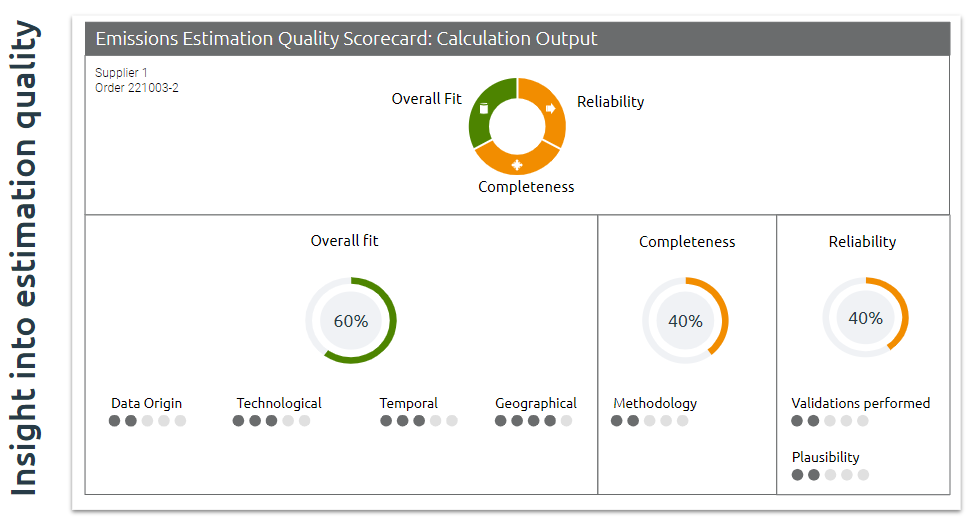
Fig. 1-2. Stage 2: Emissions Estimation Quality Scorecard.
Benefits of the Quality Scorecards
The quality scorecards provide a systematic and structured approach to evaluating emissions estimates. The goal is not for analysis on an individual transaction level (a feat which is unrealistic for businesses that place thousands of orders per year). Rather, to allow these scores to be aggregated, compared and analysed over time per product category, supplier or geography, thereby allowing for better steering of targeted improvement programs. By scoring each of the calculation methods, a client can drill down to understand why a specific calculation method was chosen for that product, and what information is required to shift to a more accurate calculation method going forward.
This information is not only beneficial for supplier engagements. Through the evaluation of product overlap and quality of fit, it can also assist with the selection of third party databases. In this way, companies can assess whether it makes sense to opt for a paid database for products with higher emissions that are poorly represented by free databases. This consideration will become more important as carbon taxes start to impact on a broader scale.
A final benefit of the scorecards is in the assurance process. Auditors will be able to verify that the emission factors used are both relevant and reliable and that the calculation methodologies selected are appropriate based on the data quality audit trail. Further, it will allow the auditor to track improvements in estimation accuracy over time. All of this will help to ensure that the sustainability audit is completed in a timely manner, in the same period as the financial audit.
More than just a compliance exercise
Realistically, reasonable assurance engagements on Scope 3 emissions remain a long way off. The complexities involved in collecting and verifying information gathered from the value chain can create undue costs to businesses if they aren’t given sufficient time to prepare. So, why start thinking about data quality now?
In part 2 of the recent ISSB Corporate Reporting Webinar Series, ‘Any size or stage - Getting started on climate disclosure’, there was a discussion on whether this disclosure was more of a compliance exercise or if it could be used to drive strategy.
According to Richard Manley (Chief Sustainability Officer and head of Sustainability Investing, CPP Investments, Chair, ISSB Investor Advisory Group), the reason to pursue this data and integrate it into decision-making, is the belief that “using a more expansive set of data upon which to make decisions” and hence creating a more informed decision-making process, is likely to yield better decisions. And, as he claimed, “If you approach this as a compliance exercise, it’ll be painful. If you approach this as a value-creation exercise, it’s likely to be very rewarding.”
Are you ready to start creating value? If you are looking for a reliable solution to measure, track & improve your emissions estimation accuracy over time, we can help. Contact us or click here to find out more.
1Extract from the IDC whitepaper Implementing Scope 3 Emissions Reporting: Challenges and Benefits